3-Methyl-4-OH-Phenylglycol (MHPG) is a byproduct of the central nervous system’s norepinephrine (NE) metabolism. MHPG metabolizes to vanilmandelic acid (VMA) in the liver using the enzymes alcohol dehydrogenase and aldehyde dehydrogenase. Urinary MHPG was originally thought to represent CNS sympathetic output, but is now known to be principally derived from peripheral neuronal NE metabolism.
MHPG has been widely studied as a marker to predict response to medications used in mood disorders or as a biomarker to monitor pharmacotherapies.
References:
- Robertson D, Low PA, Polinsky RJ. Primer on the Autonomic Nervous System. Academic Press; 2011.
- Montoya A, Escobar R, Garcia-Polavieja MJ, et al. Changes of urine dihydroxyphenylglycol to norepinephrine ratio in children with attention-deficit hyperactivity disorder (ADHD) treated with atomoxetine. J Child Neurol. 2011;26(1):31-36.
- Hopkins SC, Sunkaraneni S, Skende E, et al. Pharmacokinetics and Exposure-Response Relationships of Dasotraline in the Treatment of Attention-Deficit/Hyperactivity Disorder in Adults. Clin Drug Invest. 2016;36(2):137-146.
- Garvey M, Hollon SD, DeRubeis RJ, Evans MD, Tuason V. Does 24-h urinary MHPG predict treatment response to antidepressants? I. A review. J Affect Dis. 1990;20(3):173-179.
- Perry G, Fitzsimmons B, Shapiro L, Irwin P. Clinical study of mianserin, imipramine and placebo in depression: blood level and MHPG correlations. Br J Clin Pharmacol. 1978;5(S1):35S-41S.
- Eisenhofer G, Kopin IJ, Goldstein DS. Catecholamine metabolism: a contemporary view with implications for physiology and medicine. Pharmacol Rev. 2004;56(3):331-349.
- Mardh G, Luehr CA, Vallee BL. Human class I alcohol dehydrogenases catalyze the oxidation of glycols in the metabolism of norepinephrine. Pro Nat Acad Sci USA. 1985;82(15):4979-4982.
- Freedman RR. Biochemical, metabolic, and vascular mechanisms in menopausal hot flashes. Fertility Sterility. 1998;70(2):332-337.
- Freedman RR. Pathophysiology and treatment of menopausal hot flashes. Paper presented at: Seminars in reproductive medicine2005.
- Gaweesh SS, Abdel-Gawad MMM, Nagaty AM, Ewies AAA. Folic acid supplementation may cure hot flushes in postmenopausal women: a prospective cohort study. Gynecol Endocrinol. 2010;26(9):658-662.
- Müller HU, Riemann D, Berger M, Müller W. The influence of total sleep deprivation on urinary excretion of catecholamine metabolites in major depression. Acta Psych Scand. 1993;88(1):16- 20.
- Baliga L, Rao A, Raja A, Rao SN. A study of urinary excretion of biogenic amine metabolites in epilepsy. Acta Neurol Scand. 1983;68(6):413-416.
- Garvey MJ, Tollefson GD, Orsulak PJ. Elevations of urinary MHPG in depressed patients with panic attacks. Psychiatry Res. 1987;20(3):183-187.
- Frankenhaeuser M, Lundberg U, Rauste von Wright M, von Wright J, Sedvall G. Urinary monoamine metabolites as indices of mental stress in healthy males and females. Pharmacol Biochem Behav. 1986;24(6):1521-1525.
- Lehnert H. Pheochromocytoma: Pathophysiology and Clinical Management. Vol 31: Karger Medical and Scientific Publishers; 2004.
- Seiden LS, Miller FE, Heffner TG. Neurotransmitters in Attention Deficit Disorder. Attention Deficit Disord Pod: Attention Deficit Disord Pod. 2013:223.
- Schildkraut JJ, Orsulak PJ, Schatzberg AF, et al. Toward a biochemical classification of depressive disorders. I. Differences in urinary excretion of MHPG and other catecholamine metabolites in clinically defined subtypes of depressions. Arch Gen Psychiatry. 1978;35(12):1427-1433.
- Gerner RH, Gwirtsman HE. Abnormalities of dexamethasone suppression test and urinary MHPG in anorexia nervosa. Am J Psych. 1981.
The role of hepatic alcohol and aldehyde dehydrogenase explains the clinical observations that ethanol consumption decreases the excretion of VMA, while increasing MHPG.
Because norepinephrine is involved in the pathophysiology of hot flashes in postmenopausal women, MHPG levels have been studied in this patient population.
Interestingly, folic acid was found to interact with receptors causing subjective improvement in symptoms.
Sleep deprivation can act as a stimulus to the peripheral sympathetic nervous system, which can influence central nervous noradrenergic neurotransmitter levels and elevate MHPG.
As a central nervous system metabolite, levels can correlate with central catecholaminergic disturbances, as in anxiety and seizures.
Elevated MHPG levels have also been associated with the stress response.
Pheochromocytomas are rare, mostly benign tumors of the adrenal medulla which can secrete catecholamines causing a wide array of sympathetic symptoms. These tumors contain MAO and COMT. They can therefore produce MHPG. However, because peripheral sympathetic nerves can also contribute to high MHPG, using MHPG for diagnosis of pheochromocytoma limited. VMA is also not very sensitive for diagnosis of pheochromocytoma because it can be made in the liver from MHPG. Although neither organic acid is diagnostic of pheochromocytoma, it is possible to see elevations of these analytes in the disease.

Import lab results from multiple providers, track changes over time, customize your reference ranges, and get clear explanations for each result. Everything is stored securely, exportable in one organized file, and shareable with your doctor—or anyone you choose.
Cancel or upgrade anytime

Since catecholamines are made from dopamine, low levels of the MHPG metabolite can result from low levels of dopamine, dopamine amino acid precursors, nutrient enzymatic cofactor deficiencies in dopamine metabolism, and overall methylation defects. Low levels of MHPG have been correlated to mood and behavioral disorders, anorexia, and ADHD.
Laboratories
We accept reports from any lab, so you can easily collect and organize all your health information in one secure spot.


Pricing Table
Choose the plan that fits you — and turn scattered lab reports into clear insights you can finally use.
Pick a plan that fits you — and turn scattered lab reports into clarity.
Personal plans
Professional plan
$15/ month
Access your lab reports, explanations, and tracking tools.
$250/ once
Pay once, access everything—no monthly fees, no limits.
Professional plan
$45/ month
Designed for professionals managing their clients' lab reports
About membership
 Import Lab Results from Any Source
Easily upload lab results from any provider, whether it's a hospital, independent lab, or home testing service. We support PDFs, scanned documents, and JPEGs from patient portals. No need to log in to multiple platforms — everything is centralized in one secure space.
Easily upload lab results from any provider — we support PDFs, scans, and images. Keep all your reports organized in one secure place.
 See Your Health Timeline
Every lab result is automatically organized on a chronological timeline, giving you a complete picture of your health journey. Whether you're tracking a condition, managing treatments, or staying proactive, the timeline helps you and your doctor understand how things progress over time.
Every lab result is automatically organized on a chronological timeline, giving you a complete picture of your health journey.
 Understand What Your Results Mean
Whether it's a blood test, GI panel, urinalysis, or something else, lab reports measure numerous biomarkers that reveal what's happening inside your body. Our extensive database covers over 10,000 biomarkers, providing clear, simple explanations of what each result means and how you can take action—no matter your membership level. Say goodbye to confusion and get the insights you need to better understand your health.
Our database covers over 10,000 biomarkers with clear, simple explanations—so you can finally understand your results and what to do next.
 Enter Your Lab Reports Yourself — Always Free
Enter Your Lab Reports — Always Free
If you'd like to handle inputting your health data into your account, you can do so with our easy-to-use data entry forms. Our user-friendly form is designed to guide you through the quick and easy submission process, making it simple to keep track of your health metrics. This is available to both Complete plan and Unlimited plan members.
Our user-friendly form guides you through a quick, simple submission process, making it easy to enter your health metrics.
Add your results anytime with our easy entry form. It's quick, guided, and helps you stay organized — free for all members.
 Visualize Your Results
View your lab data through easy-to-read graphs and tables. Quickly spot patterns, track changes, and compare results across different dates — all without digging through multiple reports. You can also select and compare graphs of specific biomarkers side-by-side to better understand how they relate and change over time.
See your lab reports in clear graphs and tables. Spot patterns, track changes, and compare results over time — all in one place.
 Export Your Complete Lab History in a Single File
Export Your Complete Lab History
After collecting lab results from different providers, you can download your entire history combined into a single file. Choose from PDF, Excel, or CSV formats to easily review, share, or get a second opinion—no more juggling multiple reports.
After collecting lab results from different providers, you can download your entire history combined into a single file.
 Comprehensive Data Entry Service for Your Reports
Data Entry Service for Your Reports
Our inclusive service handles the data entry for your lab reports. Just submit your information and we'll take care of the rest. Complete plan members receive one report entered for free, then $15 per report after that. Unlimited plan members receive ten report entries for free, then $15 per report after that.
Our inclusive service handles the data entry for your lab reports. Just submit your information and we'll take care of the rest.
 Securely Share With Anyone You Trust
Whether you're working with a doctor, nutritionist, caregiver, or wellness coach, you can securely share your complete lab history by sending an invite link to anyone you trust. You have full control over who sees your information and for how long, ensuring your privacy and peace of mind at every step.
Share your full lab history with your doctor, nutritionist, or coach using a secure invite link.
Discover


I have been using Healthmatters.io since 2021. I travel all over the world and use different doctors and health facilities. This site has allowed me to consolidate all my various test results over 14 years in one place. And every doctor that I show this to has been impressed. Because with any health professional I talk to, I can pull up historical results in seconds. It is invaluable. Even going back to the same doctor, they usually do not have the historical results from their facility in a graph format. That has been very helpful.
Anthony
Unlimited Plan Member since 2021

What fantastic service and great, easy-to-follow layouts! I love your website; it makes it so helpful to see patterns in my health data. It's truly a pleasure to use. I only wish the NHS was as organized and quick as Healthmatters.io. You've set a new standard for health tracking!
Karin
Advanced Plan Member since 2020

As a PRO member and medical practitioner, Healthmatters.io has been an invaluable tool for tracking my clients' data. The layout is intuitive, making it easy to monitor trends and spot patterns over time. The ability to customize reports and charts helps me present information clearly to my clients, improving communication and outcomes. It's streamlined my workflow, saving me time and providing insights at a glance. Highly recommended for any practitioner looking for a comprehensive and user-friendly solution to track patient labs!
Paul
Healthmatters Pro Member since 2024
Healthmatters is a personal health dashboard that helps you organize and understand your lab results. It collects and displays your medical test data from any lab in one secure, easy-to-use platform.
With a Healthmatters account, you can:
Professionals can also analyze client data more efficiently and save time managing lab reports.
Healthmatters.io personal account provides in-depth research on 4000+ biomarkers, including information and suggestions for test panels such as, but not limited to:
You can combine all test reports inside your Healthmatters account and keep them in one place. It gives you an excellent overview of all your health data. Once you retest, you can add new results and compare them.
If you are still determining whether Healthmatters support your lab results, the rule is that if you can test it, you can upload it to Healthmatters.
While we work with many popular labs, we welcome reports from lots of other places too.
It's as simple as this: if you can get a test done, you can upload it to Healthmatters and we can interpret results from any lab out there. If laboratories can analyze it, we can interpret it.
If you're on the hunt for a specific biomarker, contact us and we'll add it to our database. Anything from blood, urine, saliva, or stool can be uploaded, understood, and tracked with your Healthmatters account.
The Complete Plan ($15/month) is perfect for individuals who want ongoing access to their health data. It includes unlimited lab imports, visual tracking, custom ranges, result explanations, full account exports, and secure sharing — all with a simple monthly subscription. You can cancel anytime and restart your plan whenever you're ready — your data will still be there waiting for you. You can also upgrade to the Unlimited Plan at any time, with the cost prorated based on what you've already paid.
The Unlimited Plan ($250 one-time) is also designed for individuals but offers lifetime access with no ongoing subscription. You'll get all the same features as the Complete Plan, plus a larger initial data entry allowance (10 reports), making it a great choice if you prefer a one-time payment and long-term use without monthly fees.
In short:
There are two ways to add your test reports to your Healthmatters account. One option is to input the data using the data entry forms. The other method is to utilize our "Data entry service."
Our data entry forms offer an easy, fast, and free way for you to input the reports yourself. Self-entry allows you to add an unlimited number of reports at no cost. We make the self-entry process user-friendly, providing dozens of templates that pre-populate the most popular laboratory panels and offering instant feedback on entered values.
For those who prefer assistance, we offer a "Data entry service" to help you input your data. Simply attach an image or file of your lab test results, and a qualified team member from our data entry team will add the results for you.
We support various file types, including PDFs, JPGs, or Excel. This service is particularly useful if you have many reports to upload or if you're too busy to handle the data entry yourself.
Our Data Entry Service is for when you don't want to manually type in your lab results yourself. You simply upload your report (PDF, image, or screenshot), and our trained team enters the information into your Healthmatters account for you — accurately and neatly organized, ready to view in graphs, tables, and timelines.
The $15 per report covers the time and care it takes for a real person to review your file, make sure each result is entered correctly, and double-check for accuracy. This ensures your health data is precise and easy to work with — without you having to spend the time doing it yourself.
Prefer to do it yourself? You can always use our free self-entry tool to add results manually — it just takes a bit more time and attention.
For users on the Complete monthly plan, the first report is entered free of charge, and each additional report incurs a fee of $15.
Unlimited account holders enjoy the entry of ten reports without charge. Subsequent reports are subject to a $15 fee per report.
Additionally, users on the Complete plan can upgrade to a yearly subscription from the account settings. The annual subscription includes a data entry service for five reports.
All professional accounts allow you to import and onboard an unlimited number of clients and their lab results. The distinction between professional plans lies solely in the data entry service.
The Pro Monthly Plus plan is priced at $75 per month and includes a data entry service for five reports each month. Additional reports can be self-entered at no extra cost or, if preferred, you can use our data entry service for an additional fee of $15 per report.
The Pro Monthly plan is priced at $45 per month and does not include a data entry service. Self-entry is free for an unlimited number of reports, and you can opt for the data entry service at a fee of $15 per report.
You also have the option to upgrade to higher monthly or to annual plans, which come with substantial discounts. All upgrades can be done directly from your account.
Simply log in and navigate to your account settings to cancel your subscription. Scroll down to locate the 'Cancel' button at the bottom of the page. Ensure you cancel at least one day before the renewal date to prevent any charges. Once cancellation is requested, the subscription remains active until the conclusion of the current billing cycle.
Our goal has been to make your Healthmatters account as intuitive as possible.
We've crafted multiple ways for you to navigate your data, whether you're glancing at a single report or delving into your historical test reports.
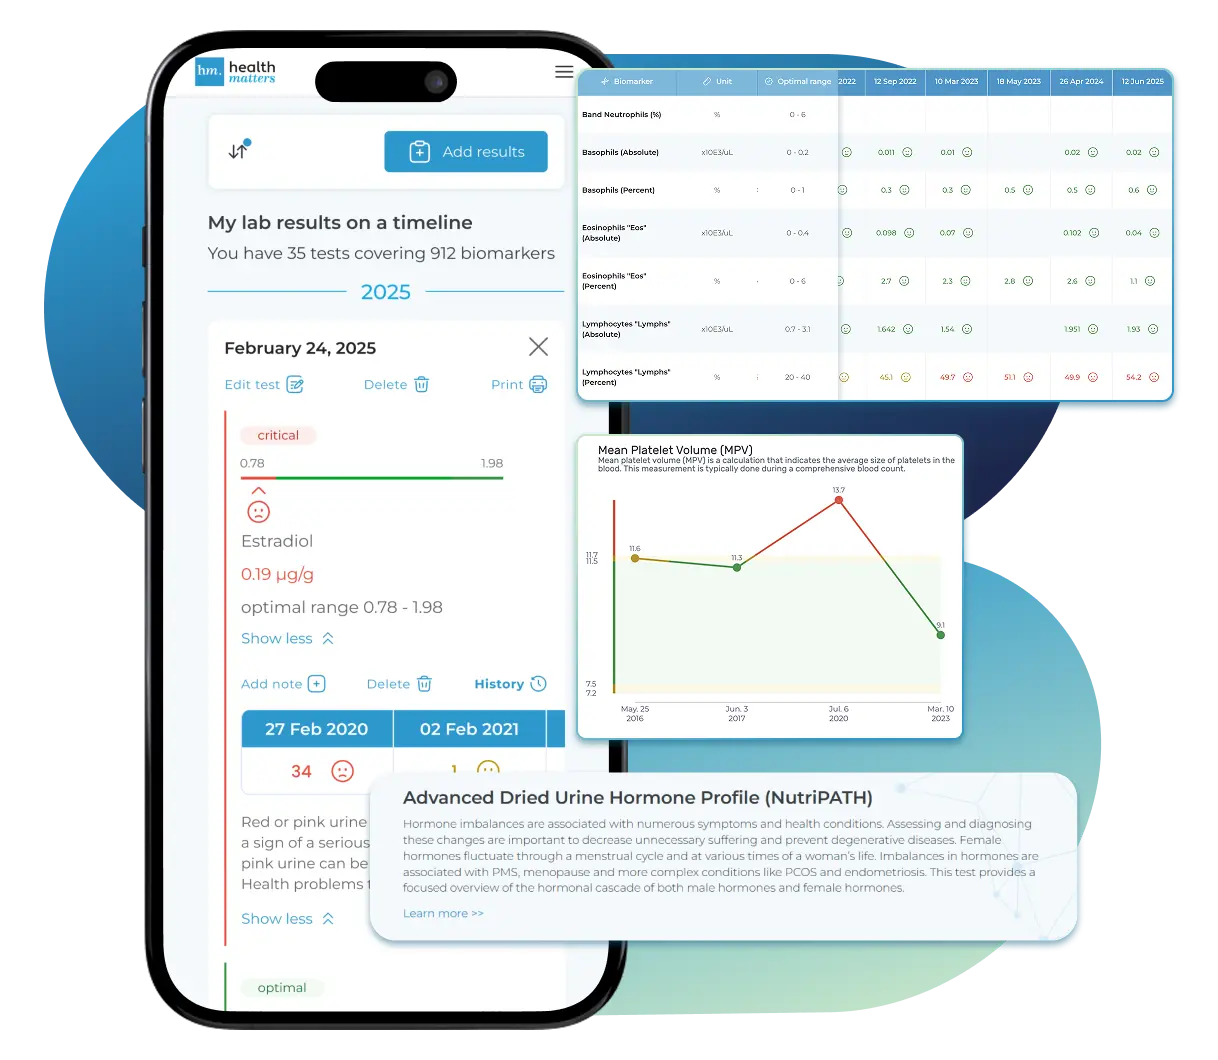
1. Graph View:Dive into a visual journey with our biomarker graphs, showcasing over 40 data points. Combining years of results unveils trends, empowering you to make informed decisions. Our visualization tools make it a breeze to compare and understand changes over time, even if your results are from different labs. A search function and filters simplify the exploration of extensive data, allowing you to focus on what needs attention.
2. All Tests ViewExplore neatly organized reports on a timeline, highlighting crucial details like dates, critical results, and lab/panel names. Each report opens up to reveal in-depth descriptions and additional recommendations for each biomarker. The history of previous results is just a click away, and you can download a comprehensive report for deeper insights. Color-coded and user-friendly, it's designed for easy reading, understanding, and navigation.
3. Table View:For a holistic view of all biomarkers side by side, our table view is your go-to. Results are neatly displayed in a categorized and dated table, ideal for those with an extensive test history. Utilize sorting, filters, and color-coding to enhance your analysis and gain extra insights.
Yes, you can download your information anytime. We offer two easy ways to export your lab data:
This makes it simple to save, back up, or share your health data whenever you need.
Yes, you can print your report. To do so, navigate to "All tests" and open the report you wish to print. You'll find a print button in the right corner of the report. Click on it, and your browser's print window will open. If you prefer to print in a bigger typeface, adjust the scale using the print window settings.
Yes, you can! We highly recommend activating Two-Factor Authentication (2FA) for your account. To do so, please navigate to the "Profile and Security" section of your account, where you will find instructions for activating 2FA.
Yes, you can. When entering values for the biomarker, you will see an "Edit Range" button. Click this button, and you'll have the option to enter a custom range.
A personal account is all about keeping your own lab test results in check. It's just for you and your personal use.
The professional account is designed for health professionals who wish to track and organize their clients' laboratory results.
To learn more about Healthmatters Pro, please refer to the professional page.
At HealthMatters, we're committed to maintaining the security and confidentiality of your personal information. We've put industry-leading security standards in place to help protect against the loss, misuse, or alteration of the information under our control. We use procedural, physical, and electronic security methods designed to prevent unauthorized people from getting access to this information. Our internal code of conduct adds additional privacy protection. All data is backed up multiple times a day and encrypted using SSL certificates. See our Privacy Policy for more details.

